Table of Contents
Project velocity is a measure of how much work a team can complete in a sprint. It is calculated by taking the total number of story points completed in a sprint and dividing it by the number of sprints. Story points are a unit of measure that is used to estimate the effort required to complete a task. You can also use the amount of time or issues completed as the unit of measurement.
Velocity is a valuable metric for project managers, as it can help them to track progress, forecast completion dates, and identify potential bottlenecks. By tracking velocity over time, project managers can see how their team’s productivity is changing and make adjustments to their project plan as needed.
In Jira, you can see your project velocity in the Velocity Report tab on the project board. In this article, you will learn how to use our Harvest Timer and Work Logs app for logging time against Jira estimates to find your project velocity.
Creating Issue Estimates
In order to find your project velocity, first you will need to create time estimates in Jira. These estimates will be used as part of the data to create the velocity report.
To estimate an issue go to the Backlog page of your project. Next, select an issue and enter in your estimate for how long the issue will take to complete based on story points or time. These estimates will be used along with the time tracked in Harvest for the issues to create the project velocity chart.
Logging Time In Harvest
Once you have created time estimates for your issues, you can then track time on them. This is the second half of data used to create the Velocity Report.
With our Harvest Timer and Work Logs for Jira, you can log time that is reflected in Harvest while working solely in Jira. You can find our app on the Atlassian Marketplace and try it for free. The app keeps your Jira work logs in sync with Harvest and allows you to see how much time is remaining on a time estimate for your task.
Once your sprint is completed, you will be able to see your project velocity. The more sprints you complete, the more accurate your project velocity forecast will be.
Create a Project Velocity Report
Once the sprint has been completed, you will be able to view a project velocity report. To see this, click on the Project Velocity tab in the Reports section in your Jira project. You will see a chart that looks something like this:
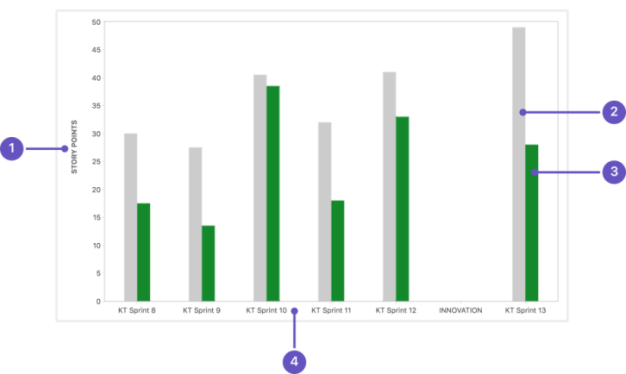
The y-axis indicated by 1 on the chart indicates the story points for the estimates and completed work. This can also be shown as the original time estimate instead, which will be measured in hours instead of story points.
The gray bar indicated by 2 is the commitment or the total amount of time estimated for all issues in the sprint when it begins. It is not updated when new issues are added to the sprint or when issues are changed after the start of the sprint.
The green bar indicated by 3 shows the total completed estimates for the sprint. This does include scope changes made after the start of the sprint.
The tab indicated by 4 shows the last seven sprints completed by the team which is the data used to find the project velocity.
Using the Project Velocity Report
With the data shown in the project velocity report, you can predict how much work a team can complete for a future sprint. This can help you track progress on your project and determine any bottlenecks. It can also help you forecast completion dates for your project as well as help you set realistic sprint goals for your team.
Over time, the numbers you see in the project velocity report should become a better reflection as to how much work a team can get done over the course of a sprint. This will happen as more data becomes available and people improve at creating accurate estimates.
Conclusion
Measuring your project velocity in Jira is a valuable metric that can help you to improve your project management process. By following the steps outlined above, you can easily measure your project velocity and use this metric to improve your project’s chances of success.